IDIAM: Interactive digital assessment in mathematics
Start date: 01/07/2021
End date: 01/07/2023
Total duration: 24 months
The project responded to challenges faced during COVID-19 by helping partner institutions use STACK to develop a) digital tools that assess competencies within science, technology, engineering and mathematics (STEM), particularly mathematical sciences and b) digital assignments within several specific mathematical subjects at the partner institutions.
Based on the STACK system, the project aimed at development of a) digital tools that assess competencies within science, technology, engineering and mathematics (STEM), particularly mathematical sciences and b) digital assignments within several specific mathematical subjects at the partner institutions.
Outcomes from this project include
- Release digital interactive problems in STACK for the course Fundamentals of Algebra and Calculus and for HELM
- Example problems in multivariate analysis, that actively use interactive 3D-graphics to illustrate mathematical concepts within multivariate analysis. 3D graphics will be also used to assess student's knowledge of multivariate analysis.
- A plugin to STACK/Moodle that makes it possible to plot interactive mathematical 3D graphics.
- Didactic studies showing how to work with several representation forms for complex mathematical concepts, such as functions, to facilitate better understanding.
Project partners
- Norges Teknisk-Naturvitenskapelige Universitet Ntnu, Norway
- The University Of Edinburgh, UK
- Friedrich-Alexander-Universität Erlangennürnberg, Germany
- Ruhr-Universitaet Bochum, Germany
Example outcomes
- HELM materials are released through the project github page, sample questions folder. Download the
HELM_Sept_23.mbzMoodle backup file for the collection of HELM materials released through this project. - For the JSXGraph part of the project example outcomes were released through their own github site. In partcular the project was key in developing further documentation for the JSXGraph-STACK connection.
Example Given a plot of a function in two variables, ask the student to select all local maxima/minima by clicking on the plot itself. The algebraic expression for is not given to the student.
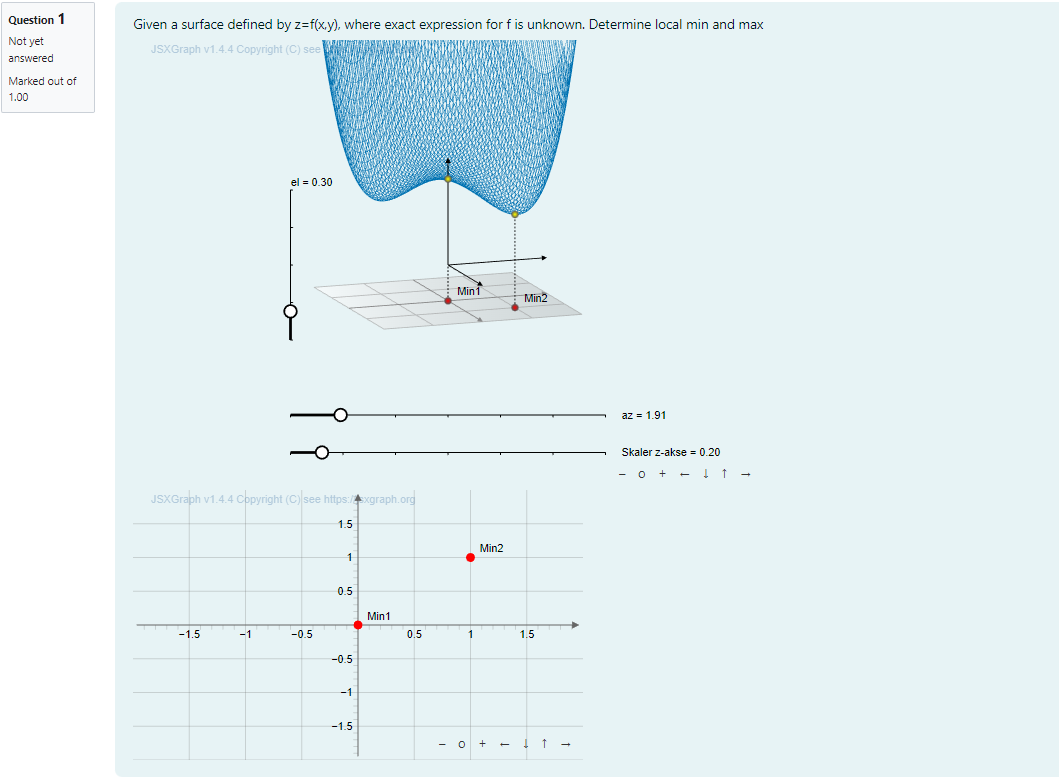
The motivation behind this question is to help the student to get familiar with surfaceplots, multivariable functions and points of interest in such plots and functions. Currently we only ask the student to identify local maxima and minima, but the question could be adapted to also ask for saddlepoints, global and local extremas and so forth.
 |