Illustrate eigenvectors by positioning vectors
Chris Sangwin, The University of Edinburgh, UK
The original purpose of STACK was to accept answers which are algebraic expressions, moving away from reliance on multiple choice questions. Through AuthOMath we have included GeoGebra diagrams within questions, allowing a student's answer to include the configuration of a diagram. This question illustrates how dynamic diagrams can be used to support more advanced topics in university mathematics.
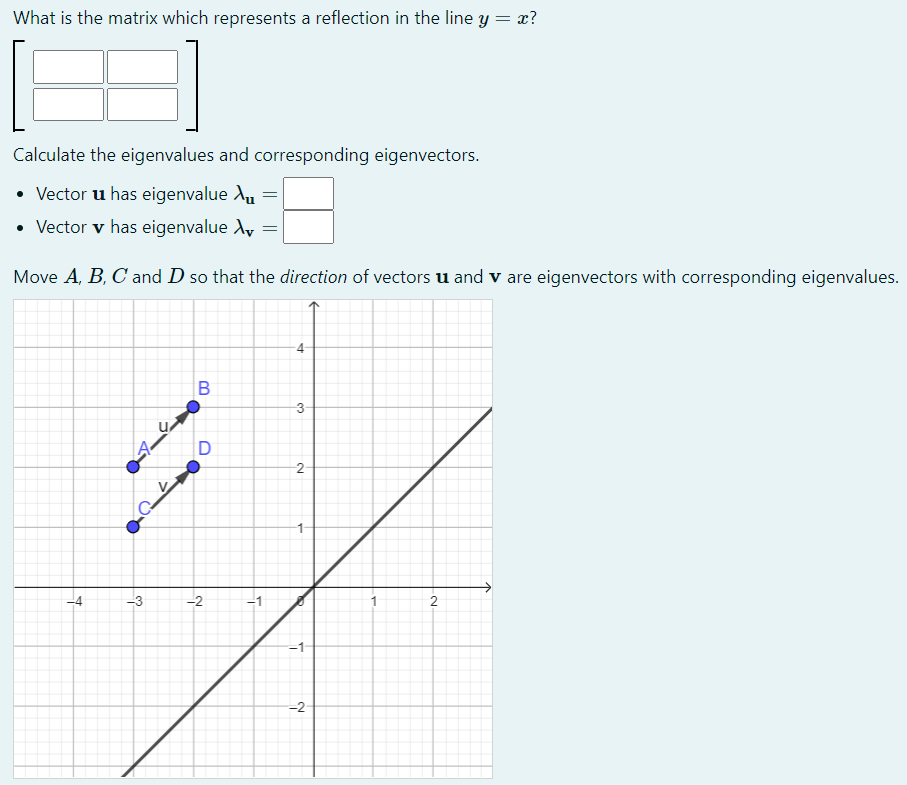
In the problem below students need to relate the eigenvectors of a matrix to the transformation represented by the matrix. Eigenvectors is a technical term for vectors which are scaled by a transformation, but remain in the same direction (or reverse direction). Understanding the effect of transformations through calculating eigenvectors and the corresponding eigenvalues is an important topic in vector spaces. Students need to find a matrix and perform some routine calculations. In addition, four points in the diagram are ready to be dragged by the user to define the endpoints of two eigenvectors.

Students get very adept at calculating eigenvectors through a mechanical procedure, but their geometric understanding can remain fragile. Excessive calculation can reinforce this problem.

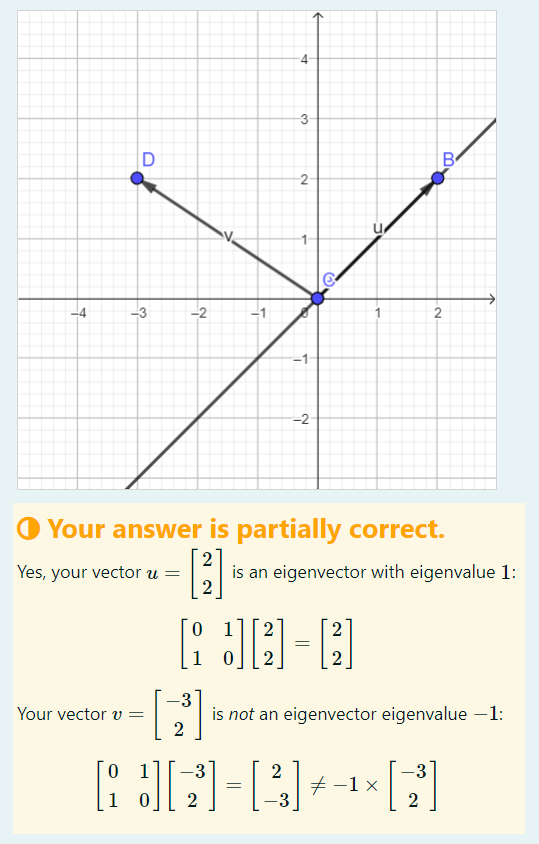
In the second figure a student has attempted to illustrate the positions of the eigenvectors. The vector is correct, but is not an eigenvector. The GeoGebra diagram returns the endpoints of the vectors, the computer algebra system establishes the relevant properties (is an eigenvector?) and then generates the feedback shown in the yellow feedback box.
GeoGebra is used to provide a visual representation of the vectors. In principal this problem could be extended to a wider range of 2D transformations, and other situations where students can demonstrate their understanding of linear algebra by positioning vectors.
